Analog TV Tuners — How We Test

As a compliment to our upcoming ATSC/NTSC combo round up I wanted to share how I test the TV tuners. Read on for the nitty gritty.
To be objective about our testing we have a group of still images, most of them are industry standard test patterns. These are compiled onto a DVD video disc and played back on a standard DVD player using the various outputs of the DVD player into the matching input on the TV capture card. For the tuner input we have to rely on a less then perfect method; we feed the video output of the DVD player into an RF modulator so it can fed via coax into the analog tuner. This process downgrades the image, this is most evident in the slight blurring/softness and a slight darkening of the image. It does however give a rough idea of the quality and most importantly allows us to feed it the test images for consistancy, some of the issues we look for aren't going to be effected by the RF modulator such as comb filtering artifacts.
These images are captured at 640×480 (essentially TV resolution). I use SageTV for its' highly flexible nature, it can be configured for multiple capture cards and with mulitple inputs differently, the configuration process is flexable and quick.
The images
 Â Â |
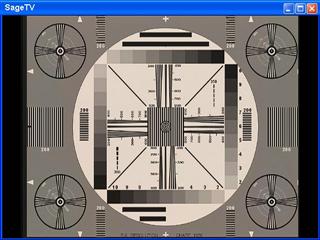
This is a very common resolution chart used on various diagnostic DVDs and industry equipment. The things to look for here are that the fine lines are properly captured, and when using composite video (or the tuner) that there aren't any rainbow (moiré) patterns in the fine lines. Click here to see an example of the chart being captured poorly. |
| Â NTSC Resolution Chart | Â |
  |
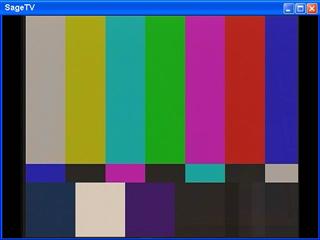
This is a test to make sure nothing odd is going on with the capture card: The bars should be clear and of course the proper colors. This chart also provides a nice test to check and see if any informating is being clipped (lost); In the bottom right-hand corner there are near black lines which can some times be omitted by poorly written TV capture card drivers. Click herefor an example fo the poor black levels. |
| Â Color Bars | Â |
  |
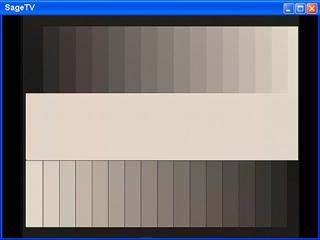
Again this is more of a basic diagnostic to make sure that a card isn't clipping anything. The bars should ramp smoothly from black to white. |
| Â Grayscale Ramp | Â |
  |
This is an actual picture rather then a test chart. The billboard is generally quite a torture test as the bright white combined with diagonal lines means that loss of the fine lines will be a clear sign that something is wrong. These fine lines are also a torture test for composite video, because if image isn't being processed with a comb filter properly the lines will produce some ugly moiré. Click here to see an example of the errors. |
| Â Piccadilly Circus Billboard | Â |
A note to readers who followed us over from HTPCnews.com:
These same basic test patterns we're used for HTPCnews reviews, however they aren't perfectly comparable. The Resolution test pattern was changed out to a corrected version (the old one had some details missing in the center region). Most importantly the older tests were done with a rather crude method of making a Super Video CD of images, which falls short of full NTSC resolution. The new tests I've performed for Missing Remote are from a DVD Video of the images which allows the full resolution of NTSC (720×480) to be utilized.
